Over the past decades of growing credit demand, stronger competition and advances in computer technology, traditional methods of making credit decisions that relied mostly on human judgment have been replaced by methods using statistical models such as custom scorecards. The following eBook will explore how custom scorecards can help substantially increase automation in the credit underwriting process and improve risk control at the point of origination while allowing financial institutions to gain more business. In other words, custom scorecards allow for a higher level of auto-decisioning, more analytics-based underwriting rules, and more profitable loans all while keeping the institutions within their risk appetites.
WHAT IS A CUSTOM ORIGINATION SCORECARD?
A scorecard (or model) is a mathematical function developed using statistical techniques that generates a score. Significant variables (or characteristics) are methodically chosen and assigned a weight. Each of the variable weights are summed to create a final score. The score is a representation for the event that we are trying to predict. For example, the probability that a loan will default or the probability that a loan will go at least 60 days delinquent within 24 months of loan origination. The function below shows a simplified example for a scorecard:
Vehicle Score=Number of Trades Score+Debt to Income Score+Age of Oldest Installment Trade Score
In assessing credit risk, a custom origination score is used very similarly to the way a generic score (such as FICO® score or Vantage® Score) is used. However, a custom score gives stronger power to differentiate levels of risk in the underwriting process (Decisioning Optimization), setting up loan structures, and defining the right level of pricing (Risk-Based Pricing). This power comes from being able to identify characteristics of the consumer base that are unique to the financial institution’s portfolio and its population. In addition to that, custom scorecards typically use application information and loan details that are predictive but not utilized within generic scorecards. Within a custom scorecard, credit bureau attributes are selectively customized to best characterize the population’s unique behaviors. The combination of application data and optimal credit bureau attributes gives a much stronger rank order of risk and allows the institution to make better credit decisions than its competitors that only use generic scores.
The custom scorecard development process involves data collection and quality checks, defining model target variable and segmentation, variable selection, model building and model validation. A sufficient length of performance history and a number of bad accounts are necessary to build a predictive custom scorecard. The model development process heavily involves working with the institution to overcome data and system limitations, accommodate business needs, and satisfy regulatory and compliance requirements. Other important activities include model validation to ensure the scorecard is working outside of the development sample and model documentation.
BENEFITS OF A CUSTOM ORIGINATION SCORECARD
As discussed above, custom origination scorecards a) optimize risk levels, allow for b) increased decisioning efficiency and automation and c) gain more business. Because the custom score is more predictive than the generic score, it will drive more of those potential bad loans into lower score ranges (more auto-decline) and more expected good loans into higher scores (auto-approval). It will allow the financial institutions to evaluate the true risk of some applicants that would have been otherwise misjudged through a generic score (more business and less loss). The generic score may accomplish this to some extent, but a custom score typically would perform much better. Institutions using custom scorecards can free up their resources to focus on the review, evaluation, and decisioning of applications that may need more scrutiny. At the same time, with the more precise risk levels associated with a custom scorecard, d) loan pricing will be more accurate because it is better aligned with the more accurate projected loan risk.
Most institutions already use application data in a range or capped format, within their credit policies or underwriting guidelines. For example, a borrower may need at least 12 months of employment history and a debt-to-income ratio below 50 percent. By including the application data in the scorecard model, the institution can now identify application attributes that are statistically significant to evaluate credit risk and choose the ranges based on empirical evidence. Additionally, because the custom scorecard is a combination of optimal risk factors, the institution can use the custom scorecard to reduce and eliminate unnecessary rules and policies that no longer differentiate credit risk, resulting in a e) more efficient and effective origination process and f) more optimized credit policies and underwriting guidelines. The analysis might also lead to the creation of interactive variables between credit bureau and application attributes that provide more predictive power than a stand-alone variable. For example, the custom scorecard can compare residence statuses provided by applicants against presence of mortgage trade line in credit files to verify if they have a mortgage or not. Therefore, g) otherwise difficult to detect patterns will be identified.
FOCUS ON STRATEGY OPTIMIZATION
Once a custom origination scorecard is developed, the financial institution needs to decide how the score will be used within its origination workflow to accomplish its business objectives. This involves performing analysis for and making decisions on issues such as A) Score cutoffs and B) Policy rules.
A. Score Cutoffs:
Similar to using a generic score, financial institutions set minimum custom score levels, referred to as cutoffs, at which they are willing to accept or decline applicants. The cutoffs represent profit or risk levels depending on business objectives. A typical starting point for selecting a suitable cutoff is to analyze the relationship between expected approval and bad rates for different scores. As the custom score outperforms the generic score, the institution can choose between getting a lower bad rate for the same approval rate it had before the introduction of custom scorecard, or a higher approval rate while holding the bad rate constant. For example, an Institution has an approval rate of 40 percent of the total through-the-door (TTD) population and a bad rate of 0.5 percent. Using the custom score, it can choose either getting an approval rate of 40 percent while lowering the expected bad rate to 0.2 percent, or increasing the approval rate to a 70 percent level while keeping the expected bad rate at constant level of 0.5 percent. More realistically, an institution will choose an “in-the-middle scenario”; a cutoff is typically chosen so that there is both gain in approval rate and decrease in projected bad rate.
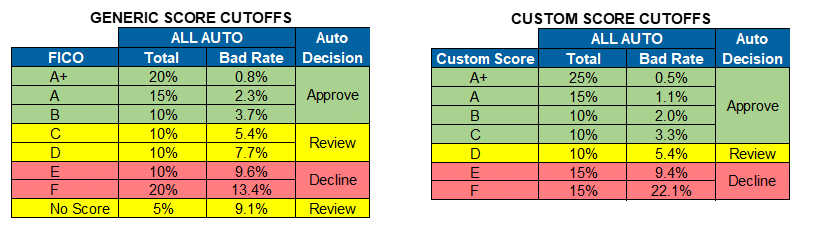
Here is a more data-driven example related to cutoffs definition: a financial institution sets the following credit tiers using a generic score:
- Underwriters would approve applications above B tier (bad rate under 3.7 percent)
- Underwriters would decline applications below E tier (bad rate over 9.6 percent).
This cutoff selection results in 45 per cent approval, 30 percent decline, and 25 percent review (See “Generic Score Cutoffs” table)
Using a custom score, the financial institution is able to set new credit tiers so that the bad rate for approval and decline are similar while increasing the approval rate by 10 percent. (See “Custom Score Cutoffs” table). Since the custom scorecard pushes more low-risk applicants to the higher-score tiers and high-risk applicants to the lower-score tiers, the institution can now quickly and more accurately assess credit risk at the point of origination and make better-informed lending decisions.
B. Policy Rules and Underwriting Guideline Optimization
Policy rules and underwriting guidelines consist of a set of qualification requirements including fraud, legal, loan structure, and risk-related rules. Examples include age requirement, verification of military status, address discrepancy check, maximum loan-to-value levels, minimum number of trades, and presence of serious delinquency such as bankruptcy or foreclosure. These rules are a necessary and prudent part of risk management. However, they should not be similar to or strongly correlate with scorecard variables since they can undermine the effectiveness of the custom scorecard. For example, if the scorecard contains variables measuring the length of an applicant’s credit history, then policy rules that single out thin-file or no-hit applicants are unnecessary.
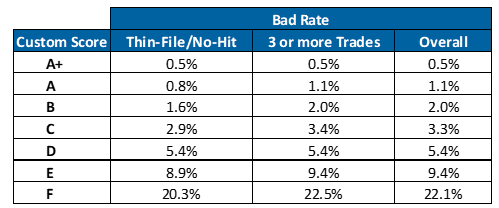
Continuing with the previous example, the same financial institution is looking number of trades in addition to the generic score. Within the same generic score tiers, thin-file/no-hit applicants have higher risk than those with more established credit history. For example, A-plus-applicants with fewer than three trades have higher bad rate than the overall A-applicants. Therefore, having a policy rule that looks at number of trades is useful to differentiate levels of risk when using a generic score.
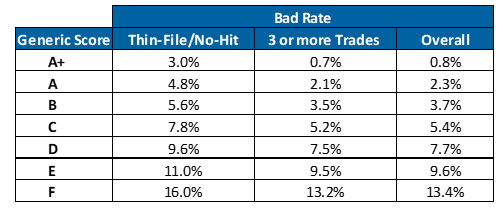
However, since the custom scorecard contains variables similar to number of trades, there is virtually no difference in risk between applicants having fewer than 3 trades and applicants with 3 or more trades at all custom score tiers. The usefulness of Number of Trades has been utilized within the custom score itself, and therefore, having this policy rule is no longer necessary.
Too often, financial institutions rely on policy rules that are overly burdensome, inefficient and sub-optimal. Sometimes years, if not decades, old rules for underwriting have been multi-layered to the point where an understanding of the strategy becomes uncertain. The custom scorecard and the analysis accompanying the implementation in production help confirm effectiveness of the existing rules and clean up the rules that would be redundant or unnecessary. A well-implemented custom scorecard will definitely allow for a more timely and accurate final decision on the borrower’s credit request.
While strategy optimization provides the most benefits to users of custom scorecards due to it being a more comprehensive model with stronger predictive power, institutions using generic scores can also leverage analytics to revisit their generic score cutoffs and review policy rules and underwriting guidelines. With data extracted from the loan origination system and core banking system, alternative combinations of score cutoffs and decisioning rules with various thresholds can be simulated. Using this methodology, institutions can improve decisioning processes while tracking the impact on approval rate and bad rate.
A SUCCESS STORY
A large financial institution (FI) decided to leverage the analytics expertise and experience of the Achieve Analytics & Business Consulting Team (Achieve Team) to:
- develop a custom scorecard for its Auto portfolio
- optimize the underwriting strategy using the new custom score
The objectives were reducing loan-processing time through more automation and providing more risk control at the point of origination through better loan default forecasting.
Before implementing the custom scorecard, the Institution performed very little auto-decisioning. The table below (Table 1) shows the level of auto-decisioning and risk associated with the Institution without the custom scorecard.
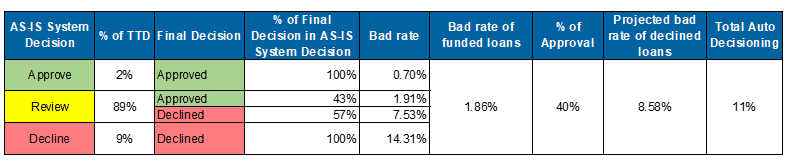
In the three-year period prior to the implementation of the custom scorecard, only 2 percent of applications were auto-approved due to an overly strict set of rules on top of the generic score. The institution used to maintain separate credit underwriting guidelines for direct and indirect vehicle applications. This was reasonable since indirect auto applications are generally riskier than direct applications, and the generic score does not account for differences in these populations. The Institution was also very conservative with its auto-decline policy, which only applied to non-members with very low generic scores.
During the project, the analysis of the behavior of the institution’s population allowed the Achieve Team to identify the default definition (or performance definition). The definition used in this specific project was the following: “loans at least 60 days past due or charged off since origination”. The custom score developed by Achieve Team provided huge improvement over the generic score, doing a significantly better job of separating good and bad applications. The scorecard model was specifically designed to address the differences in risk between direct and indirect applications, so now the Institution can use one score and one strategy for decisioning.
After the custom scorecard was developed and cutoffs were identified, the Achieve Team worked extensively with the institution to perform additional analysis that would optimize the underwriting strategy and best leverage the custom scorecard. The goal was to complement the custom score with a set of optimized policy rules and related thresholds. The Achieve Team, through advanced analytics and WHAT-IF simulations, proposed to eliminate redundant rules that were directly built into the scorecard model or were shown to provide no additional benefit in terms of risk differentiation. For the rules that the Institution believed were necessary to keep, more optimal thresholds or suitable replacements were proposed as the result of analytical assessment.
Once the origination strategy was defined, the Achieve Team simulated what would have happened to the existing applications over the past three years if the new strategy had been applied. By combining the custom scorecard and optimizing the LOS (loan organization system) decision engine, the Institution will achieve a significant increase in auto-decisioning. At the same time, the Institution will also expand its marketable universe while staying within its preferred risk appetite.
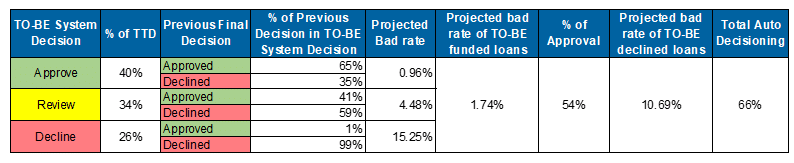
The table below (Table 2) shows the expected results of the new strategy (new custom score, new cut-offs, new set of policy rules):
The results are very promising:
- More auto-decisioning: over a 50 percent increase in automation from 11 to 66 percent. In this scenario, the institution would be able to automatically approve 40 percent of all vehicle applications, instantly decline 26 percent, and manually review 34 percent.
- Higher approval rate: under the assumption that applications with a system decision of “Review” would be approved at the same rate as before (41 percent), the manual approval rate is calculated to be 14 percent (41 percent of 34 percent). Overall, the level of approval is 54 percent, consisting of 40 percent auto-approval and 14 percent manual-approval. This is a considerable increase from 40 percent to 54 percent.
- Lower bad rate: the applications that would be approved carry a slightly lower projected bad rate compared to before, 1.74 percent versus 1.86 percent. On the other hand, applications that would be declined would have a higher projected bad rate of 10.69 percent versus 8.58 percent.
- Gain in business: Among the auto-approval, 35 percent of applications were previously declined. This represents 14 percent of gain in business since the Institution can now automatically approve these loans knowing that they are well within its risk appetite.
These results show that the custom scorecard works extremely well in separating good and bad applications. In addition to the above benefits, the Institution will now be able to decision all Auto applications (direct and indirect) using one set of rules, with the custom score and 7 optimized rules (down from 19 rules before).
Financial institutions new to using custom scorecards for decisioning might be averse to drastically changing their rules and strategies. However, using a custom scorecard by itself (without any additional layer in terms of rules) results in even greater gains when it comes to automation and risk control.
If the institution were to use only the custom scorecard and eliminate all additional rules related to credit risk evaluation, The Achieve Team forecasted a total auto-decisioning of 81 percent, including 52 percent auto-approval and 29 percent auto-decline. The projected bad rate for the auto-approved applications in this scenario is actually lower by 48 basis points compared to the one with additional rules (from 1.74 percent to 1.26 percent). Even with more applications being auto-declined, the projected bad rate of auto-declined applications increases from 10.69 percent to 11.95 percent. With just the custom score, the Institution would be able to automatically approve the very best applications and instantly decline the very worst in terms of credit risk. The expected results in the scenario of using the custom score by itself are shown below (Table 3):
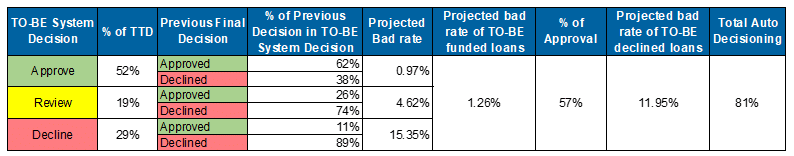
Without any rules, the Institution would lose about 3 percent of its business. This lost business represents applications that were previously approved and would now be declined. However, those applications also carry a projected bad rate of 9.38 percent. At the same time, the Institution would gain 20 percent of business, making it a 17 percent net gain (vs 14 percent in the previous scenario). This gain includes applications that were previously declined but now could be safely approved with lower risk.
CONCLUSION
The Achieve Team helped a FI improve its credit-decisioning framework. In order to accomplish this goal, the Achieve Team developed a custom scorecard and performed advanced data analytics to optimize the decisioning strategy. The Achieve Team also assessed the benefits of the introduction of a new decisioning approach of using only the custom scorecard.
The results were significantly good:
- 55 percent increase in automation, including 38 percent in auto-approval and 17 percent in auto-decline
- At least 14 percent gain of new business. These are low-risk applications that were previously declined due to sub-optimal risk assessment, but now can be approved with higher custom scores
- 10 basis point lower projected bad rate for funded loans compared to the current bad rate
Here are the additional benefits achieved from the custom scorecard and the new optimized decisioning framework:
- The credit underwriting process is streamlined, with fewer (but more impactful) policy rules
- One simplified process to underwrite both indirect and direct auto applications, with custom scorecards built specifically to address the difference in risk characteristics
- Better assessment of credit risk which allows for a more accurate Risk-Based Pricing
- More adherence to compliance (fair lending) given the increased level of automation
The Achieve Team absolutely believes that a custom scorecard is the best approach to maximize the automated underwriting, have more risk control, lower compliance and operational risk, and ultimately increase profitability with new market share.
THE TEAM
MeridianLink Consulting provides analytics, consulting services, and advanced data reporting aimed at maximizing returns for every phase of the lending/credit process. The Achieve mission is to maximize customer satisfaction by providing professional services of the utmost quality to meet clients’ needs and exceed their expectations.
We strongly believe that every financial organization should be driven by the concept of the continuous improvement approach. We have organized our teams and offerings around this concept. We have three practices to help you reach a virtuous and continuous improvement approach:
- The Consulting Practice will help you design and optimize your credit process.
- The Analytics Practice will allow you to design and optimize your strategies.
- The Data and Reporting practice will help you monitor your performance and fine-tune your results.
>> Download This Article